|
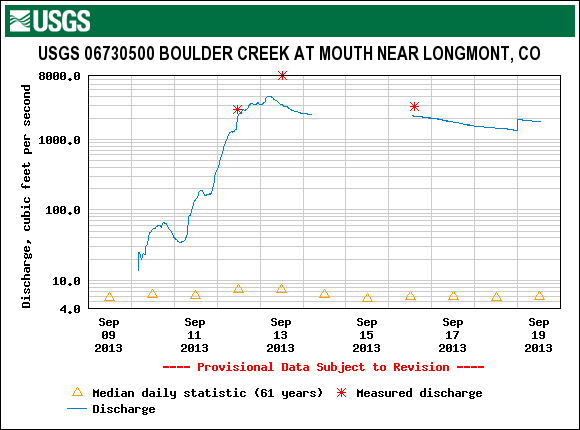
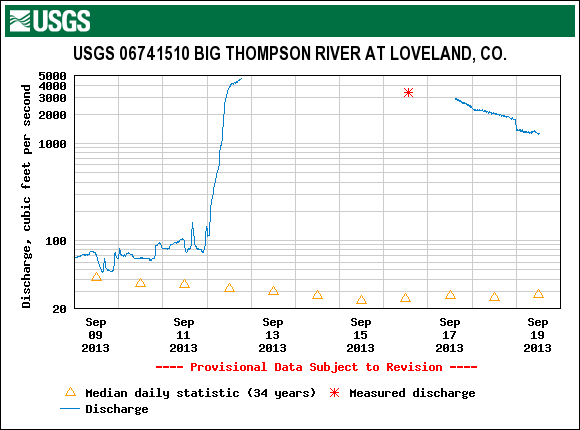
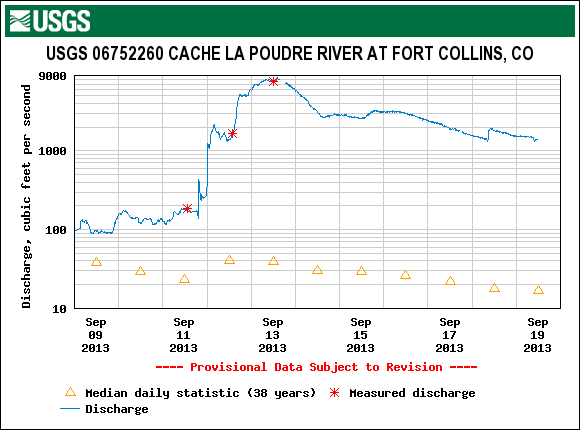
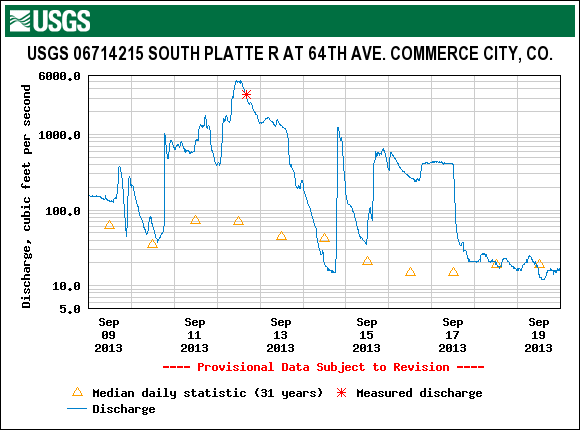
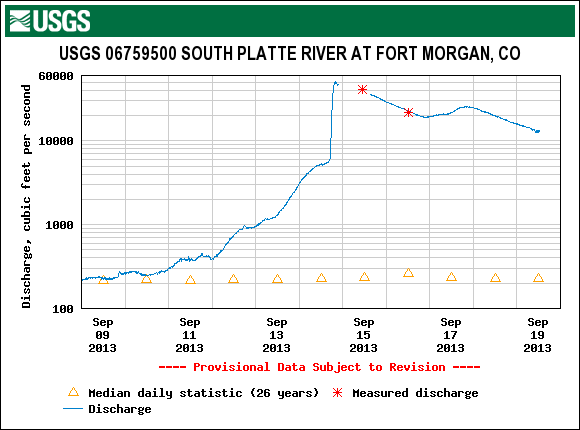
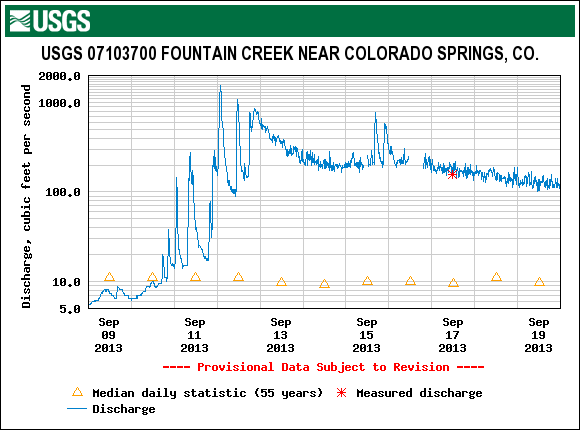
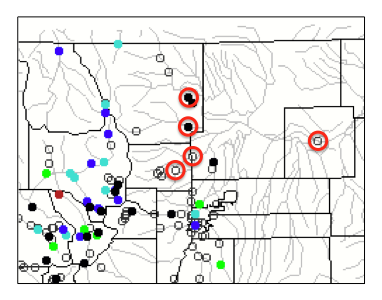
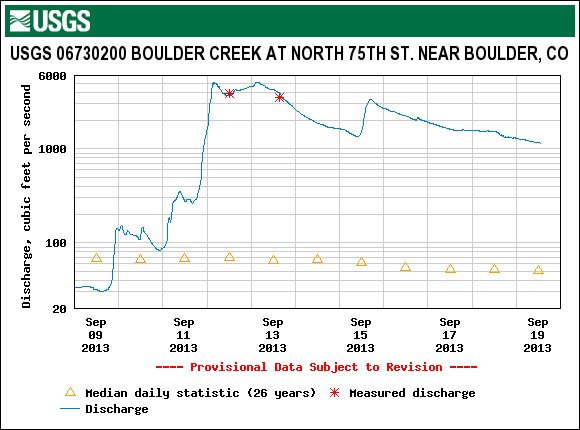
The images to the left show real time streamflow along Boulder Creek, and Big Thompson, Poudre, and South Platte rivers. Heavy rains fell in the higher elevations above Boulder, Loveland, and Fort Collins. This caused the rivers to swell (after already experiencing higher flows due to late summer precipitation in the mountains). Higher flows headed toward the lower elevation cities, which were also receiving much above average precipitation. All of this combined to greatly increase the rivers' flows through the cities. In the hydrographs to the left, the yellow triangles denote the median (normal) flow during September at their respective locations. Normal flows for Boulder Creek, Big Thompson River, and Poudre River are all around 10 to 50 cfs (cubic feet per second). On September 9, those gages showed flows close to normal. On September 12, flows greatly increased to over 6000 cfs on Boulder Creek, 5000 cfs on the Big Thompson, and 9000 cfs on the Poudre River. That's over 10,000% of average! All of these rivers are tributaries to the South Platte River. The South Platte didn't swell as much at higher elevations. Though it did experience some increases from the rains (as can be seen at the Commerce City location), the largest increases downstream were almost entirely due to very large increases in Boulder Creek, Big Thompson, St. Vrain, and Poudre flowing into it. One image on the left shows the South Platte River at Fort Morgan. Its normal flow for September at this location is 200 cfs. Two days after the flows increased near the foothills towns, those large flows finally reached Fort Morgan. On September 14, flows increased to a peak of 50,000 cfs. That's 25,000% of average! The bottom image on the left shows the increase in flows along Fountain Creek near Colorado Springs. Though the center of the system was located over northern Colorado, areas around Colorado Springs also saw intense precipitation accumulations on the 11th and 12th, and a subsequent large rise in flows in that area.
Check out the following website to see more about streamflow and river conditions:
|