 |
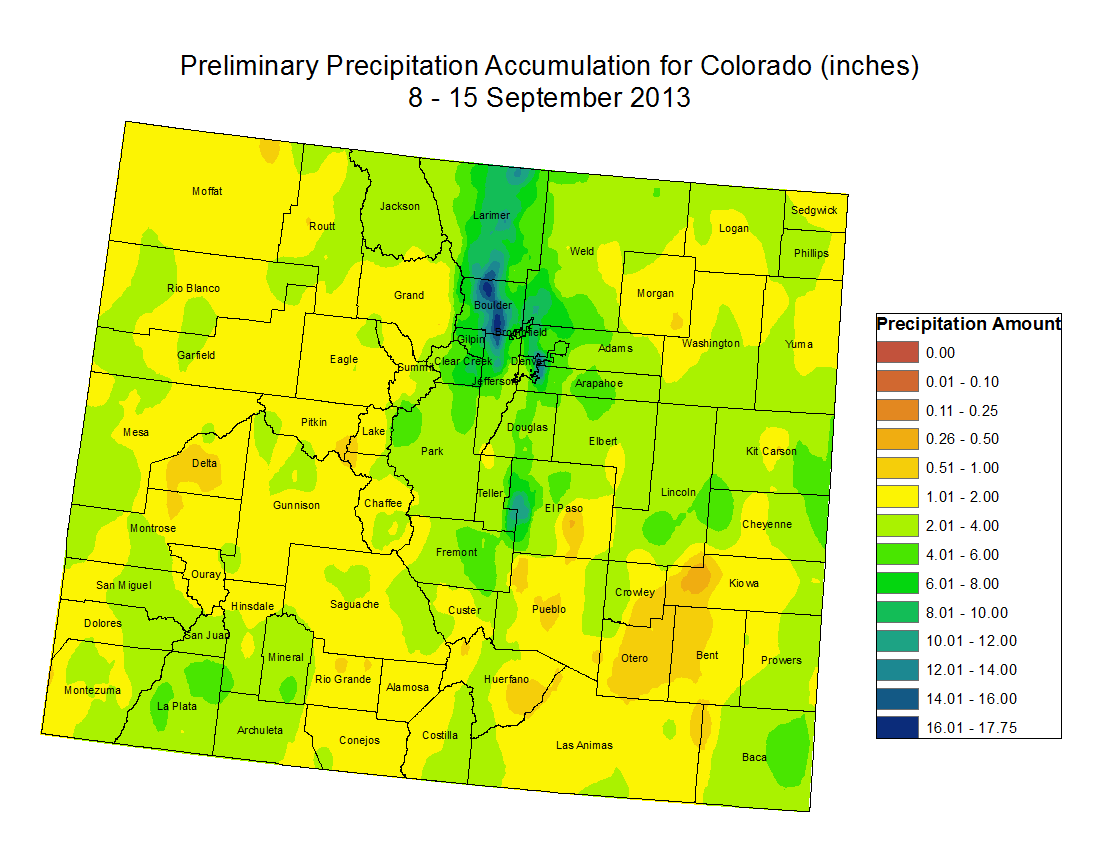
Storm totals from September 8th - September 15th This map is compiled by the Colorado Climate Center and uses data from NWS COOP, RAWS, CoCoRaHS, NRCS SNOTEL, and CoAgMet stations. The majority of the state received over 1 inch of moisture in the week. Many areas saw more than 2 inches (green and blue colors). The heaviest concentration of precipitation starts around Colorado Springs in El Paso County and extends north along the entire northern Colorado Front Range. Heavy accumulations ranged from 4 inches to over 15 inches. For most of these locations, the annual average rainfall amount is approximately 20 inches. Average September precipitation east of the Continental Divide is below 2 inches. Click the map to see the full resolution image.
|
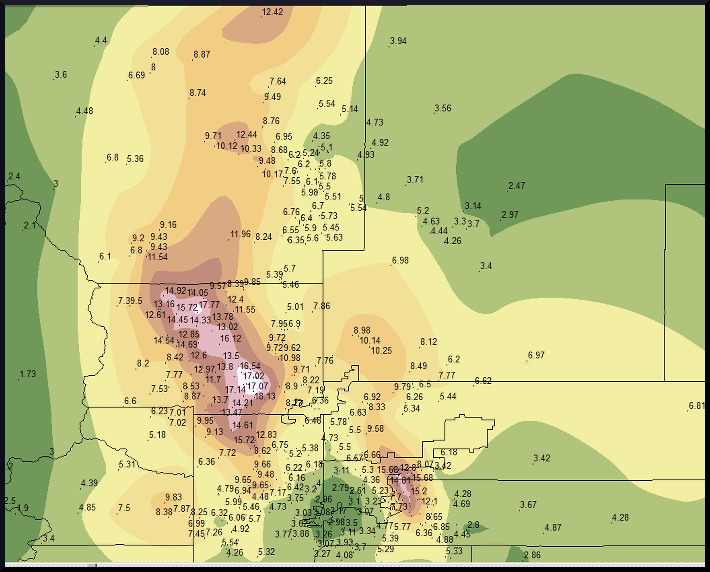 |
This map was released by the National Weather Service Boulder office. It shows more specific totals around the Denver
Metro area and into Boulder and north to Fort Collins. Storm totals were gathered from NWS COOP, CoCoRaHS, SNOTEL,
RAWS, alert reports, and spotter reports. The map highlights Boulder and Aurora as the heaviest hit spots, with
Aurora totals between 10 and 15 inches and many areas in Boulder over 15 inches. The NWS also provides a table with the station names for all the storm totals. To see their table, click here. |
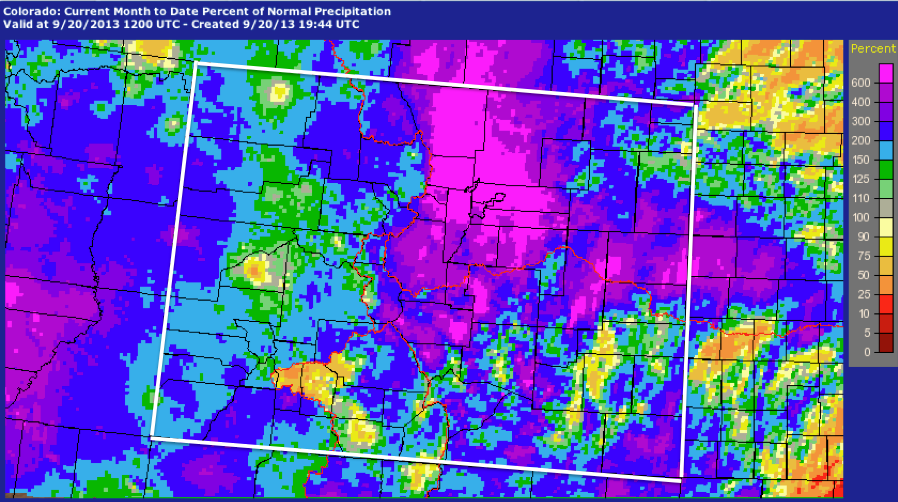 |
This map, released by the Advanced Hydrologic Prediction Service, shows month-to-date the percent of average precipitation that has fallen across the state. The area where the storm hit (east of the Continental Divide and the northern Front Range) has received over 600% of average of its normal September precipitation. |