 Historic rains and flooding affected 6 major
rivers/tributaries, 14 counties, and over a dozen cities/towns in Colorado. Go to Timeline and Impacts page for more information on counties and cities
affected by the storm. Historic rains and flooding affected 6 major
rivers/tributaries, 14 counties, and over a dozen cities/towns in Colorado. Go to Timeline and Impacts page for more information on counties and cities
affected by the storm.
 Recovery efforts are already underway and CDOT announced
it will have roads fixed or temporary roads in place by December 1st. Find more information on our Resources page. Recovery efforts are already underway and CDOT announced
it will have roads fixed or temporary roads in place by December 1st. Find more information on our Resources page.
 The Boulder cooperative observer recorded a
storm total of 17.15 inches, shattering
several records: the daily record (with 9.08"), the monthly record
(currently at 17.24"), and the annual record (currently at 30.20"). The Boulder cooperative observer recorded a
storm total of 17.15 inches, shattering
several records: the daily record (with 9.08"), the monthly record
(currently at 17.24"), and the annual record (currently at 30.20").
 Initial recordings show the South Platte at
Fort Morgan, CO peaked near 50,000 cfs (cubic feet per second) due to the storm. This is much higher than
its normal peak runoff values during the spring snowmelt runoff season. See more runoff details here. Initial recordings show the South Platte at
Fort Morgan, CO peaked near 50,000 cfs (cubic feet per second) due to the storm. This is much higher than
its normal peak runoff values during the spring snowmelt runoff season. See more runoff details here.
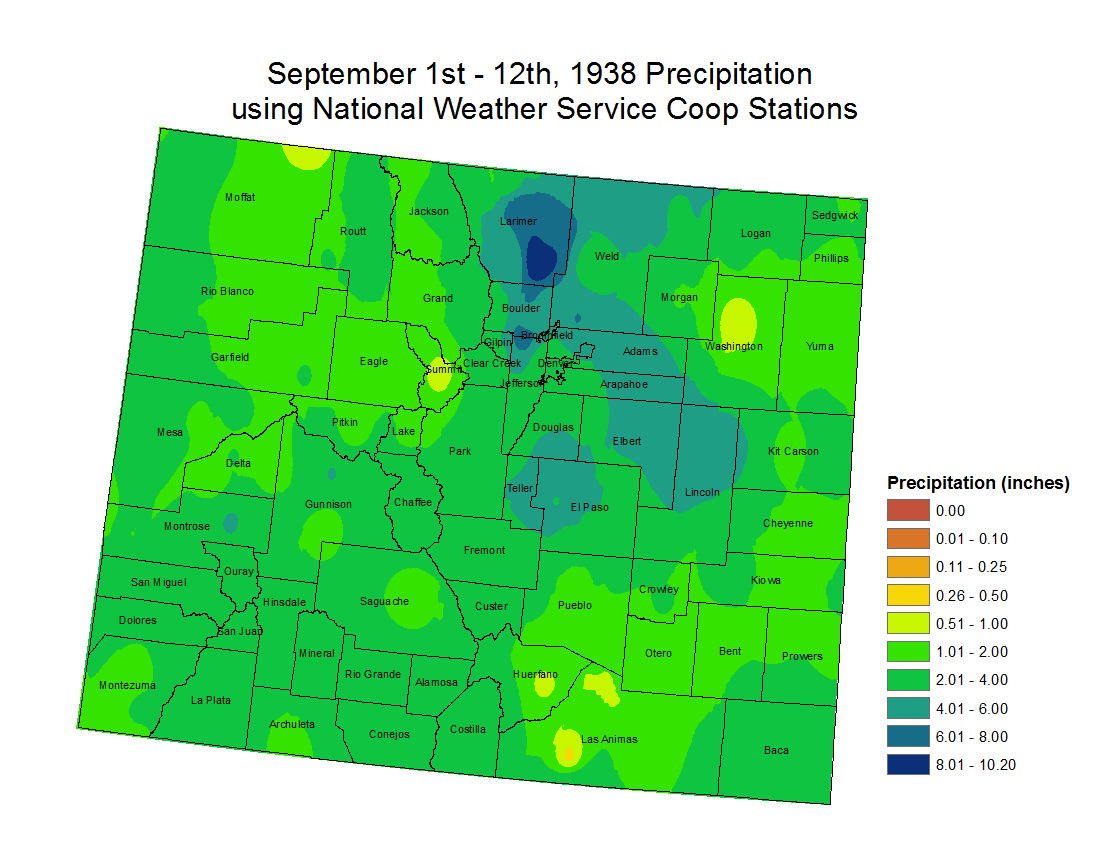
 Areas within the storm's epicenter received
over 600% of average precipitation for September 2013. Visit the Storm Totals page for more info on precipitation totals. Areas within the storm's epicenter received
over 600% of average precipitation for September 2013. Visit the Storm Totals page for more info on precipitation totals.
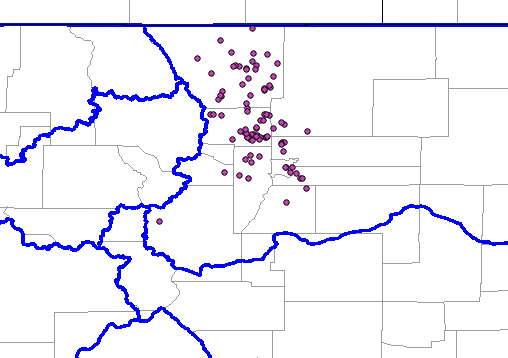
 During the period Sep. 10th - 15th, the Boulder NWS
Office issued 64 Flash Flood Warnings and 38 Flood Warnings. During the period Sep. 10th - 15th, the Boulder NWS
Office issued 64 Flash Flood Warnings and 38 Flood Warnings.
|


